


For EIP-4844, Ethereum clients need the ability to compute and verify KZG commitments. Rather than each client rolling their own crypto, researchers and developers came together to write c-kzg-4844, a relatively small C library with bindings for higher-level languages. The idea was to create a robust and efficient cryptographic library that all clients could use. The Protocol Security Research team at the Ethereum Foundation had the opportunity to review and improve this library. This blog post will discuss some things we do to make C projects more secure.
Fuzz
Fuzzing is a dynamic code testing technique that involves providing random inputs to discover bugs in a program. LibFuzzer and afl++ are two popular fuzzing frameworks for C projects. They are both in-process, coverage-guided, evolutionary fuzzing engines. For c-kzg-4844, we used LibFuzzer since we were already well-integrated with LLVM project’s other offerings.
Here’s the fuzzer for verify_kzg_proof, one of c-kzg-4844’s functions:
#include "../base_fuzz.h"

static const size_t COMMITMENT_OFFSET = 0;
static const size_t Z_OFFSET = COMMITMENT_OFFSET + BYTES_PER_COMMITMENT;
static const size_t Y_OFFSET = Z_OFFSET + BYTES_PER_FIELD_ELEMENT;
static const size_t PROOF_OFFSET = Y_OFFSET + BYTES_PER_FIELD_ELEMENT;
static const size_t INPUT_SIZE = PROOF_OFFSET + BYTES_PER_PROOF;

int LLVMFuzzerTestOneInput(const uint8_t* data, size_t size) {
    initialize();
    if (size == INPUT_SIZE) {
        bool ok;
        verify_kzg_proof(
            &ok,
            (const Bytes48 *)(data + COMMITMENT_OFFSET),
            (const Bytes32 *)(data + Z_OFFSET),
            (const Bytes32 *)(data + Y_OFFSET),
            (const Bytes48 *)(data + PROOF_OFFSET),
            &s
        );
    }
    return 0;
}
When executed, this is what the output looks like. If there were a problem, it would write the input to disk and stop executing. Ideally, you should be able to reproduce the problem.
There’s also differential fuzzing, which is a technique which fuzzes two or more implementations of the same interface and compares the outputs. For a given input, if the output is different, and you expected them to be the same, you know something is wrong. This technique is very popular in Ethereum because we like to have several implementations of the same thing. This diversification provides an extra level of safety, knowing that if one implementation were flawed the others may not have the same issue.
For KZG libraries, we developed kzg-fuzz which differentially fuzzes c-kzg-4844 (through its Golang bindings) and go-kzg-4844. So far, there haven’t been any differences.
Coverage
Next, we used llvm-profdata and llvm-cov to generate a coverage report from running the tests. This is a great way to verify code is executed (“covered”) and tested. See the coverage target in c-kzg-4844’s Makefile for an example of how to generate this report.
When this target is run (i.e., make coverage) it produces a table that serves as a high-level overview of how much of each function is executed. The exported functions are at the top and the non-exported (static) functions are on the bottom.
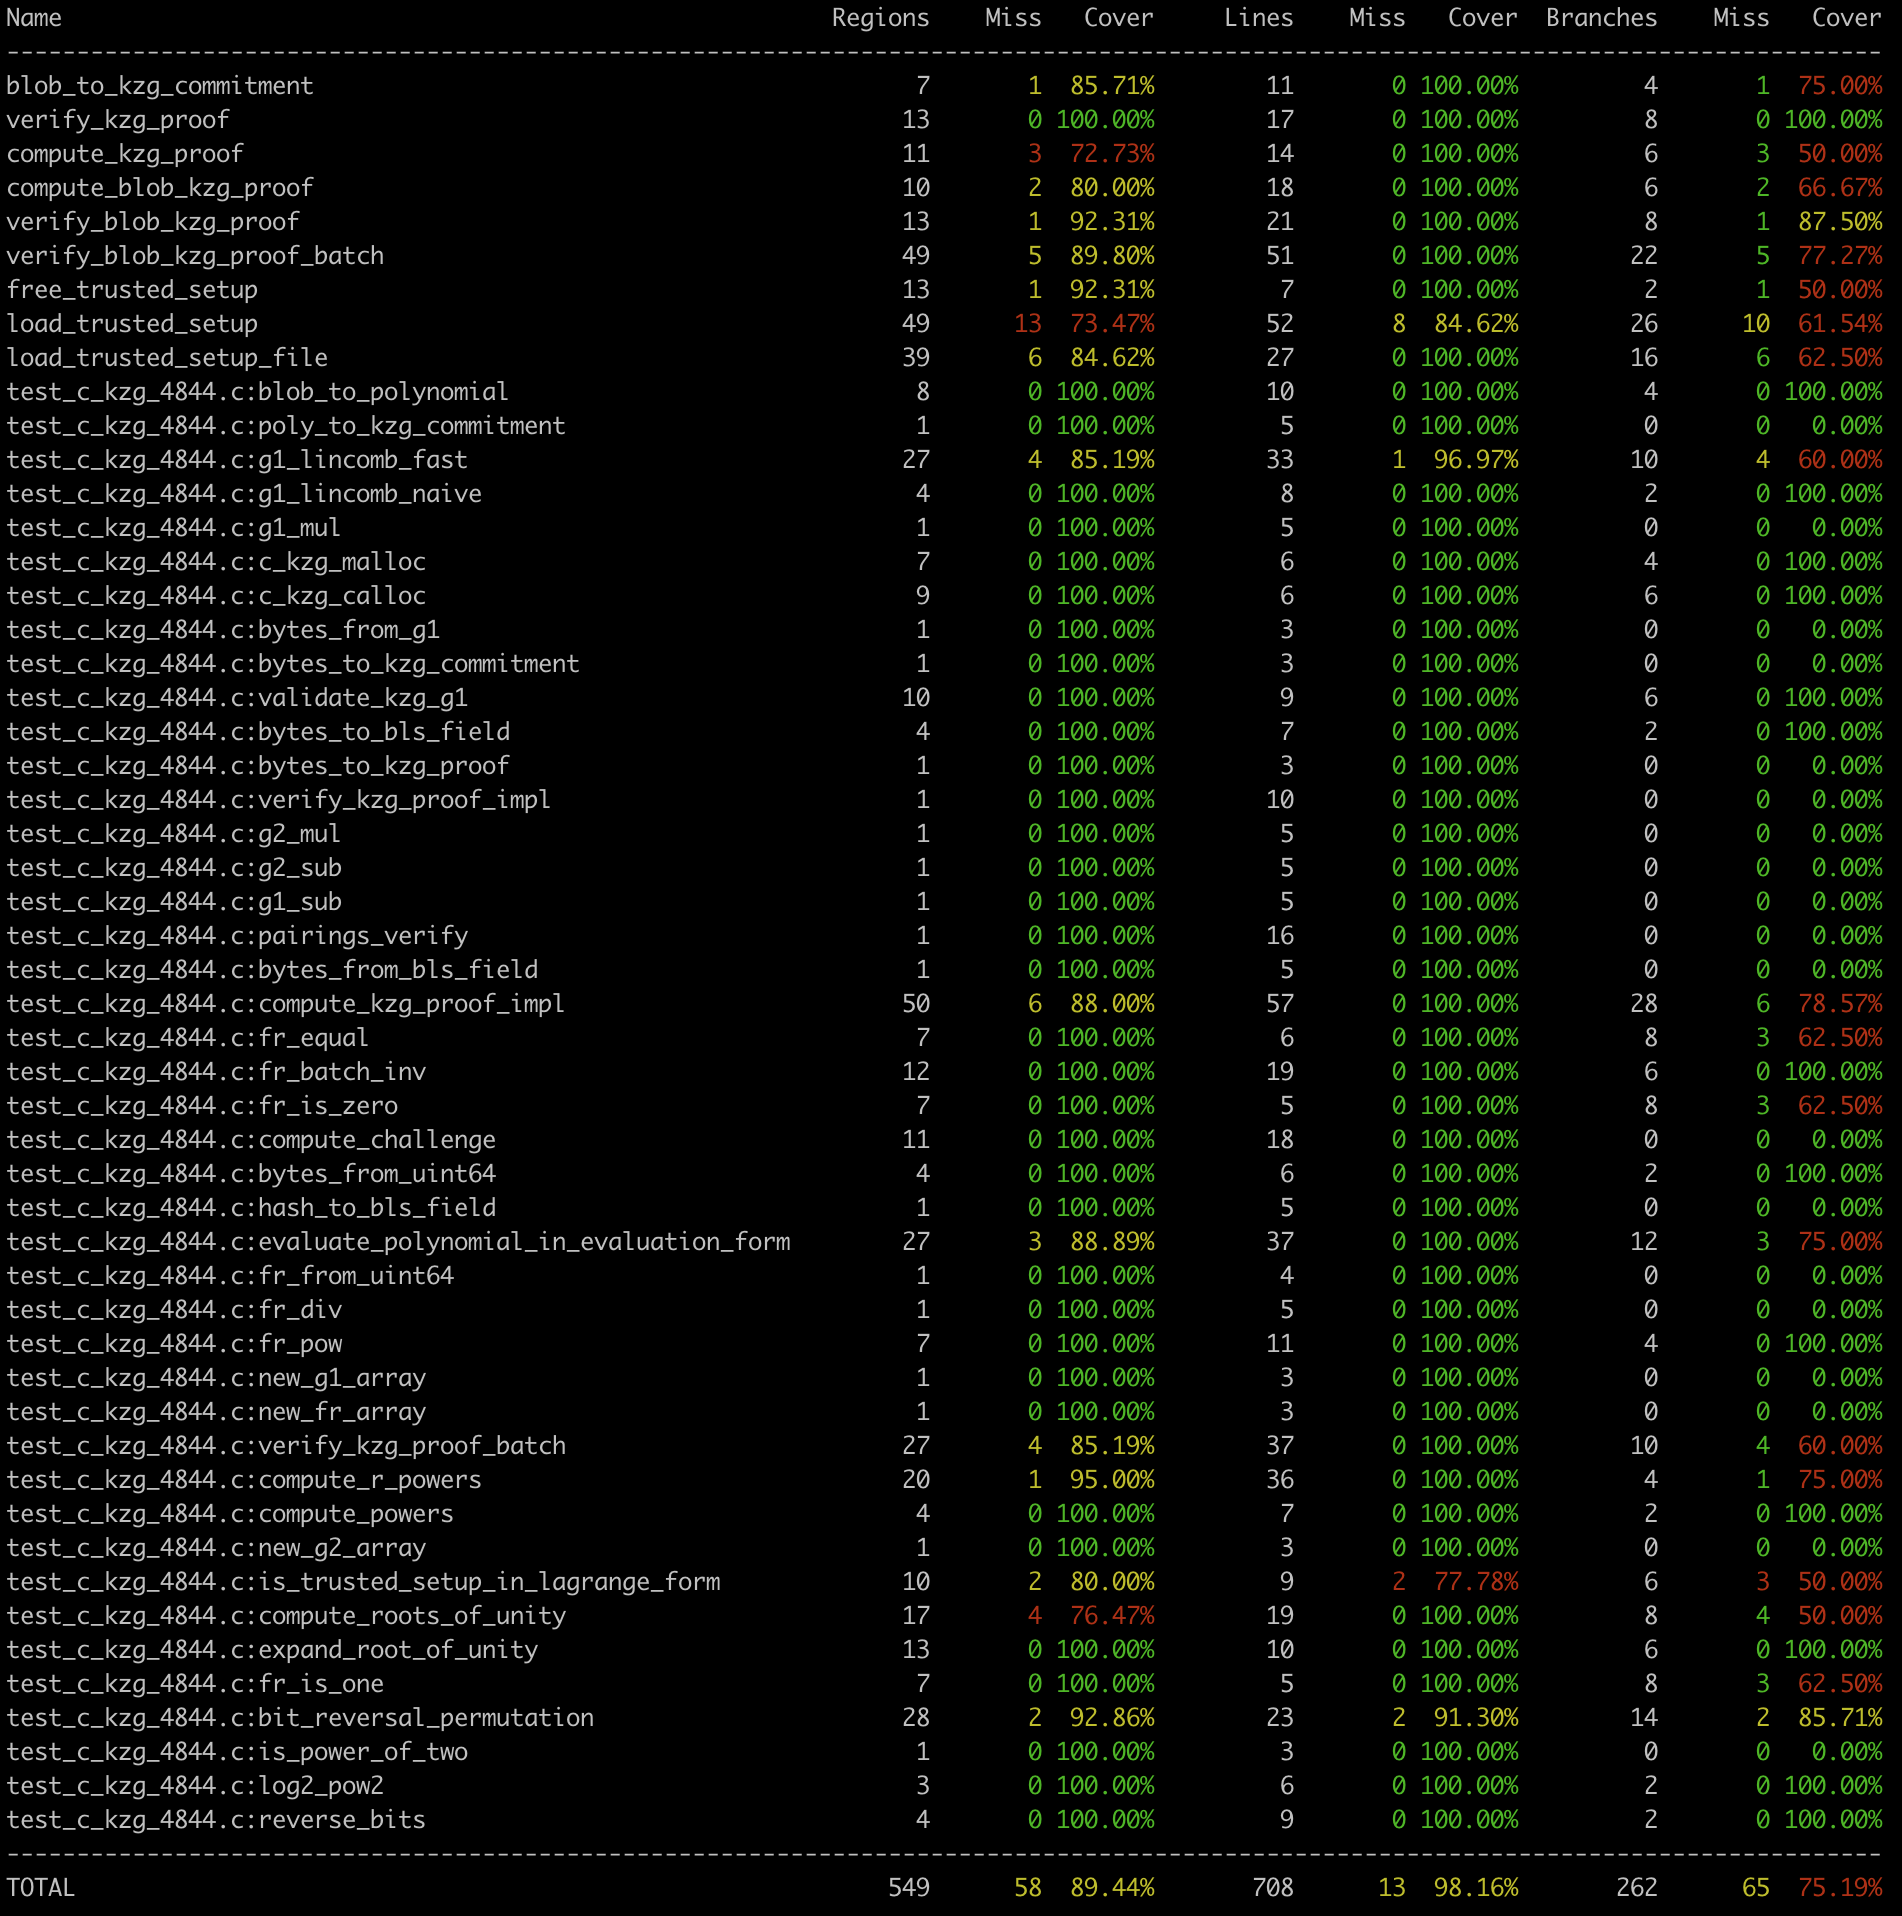
There is a lot of green in the table above, but there is some yellow and red too. To determine what is and isn’t being executed, refer to the HTML file (coverage.html) that was generated. This webpage shows the entire source file and highlights non-executed code in red. In this project’s case, most of the non-executed code deals with hard-to-test error cases such as memory allocation failures. For example, here’s some non-executed code:
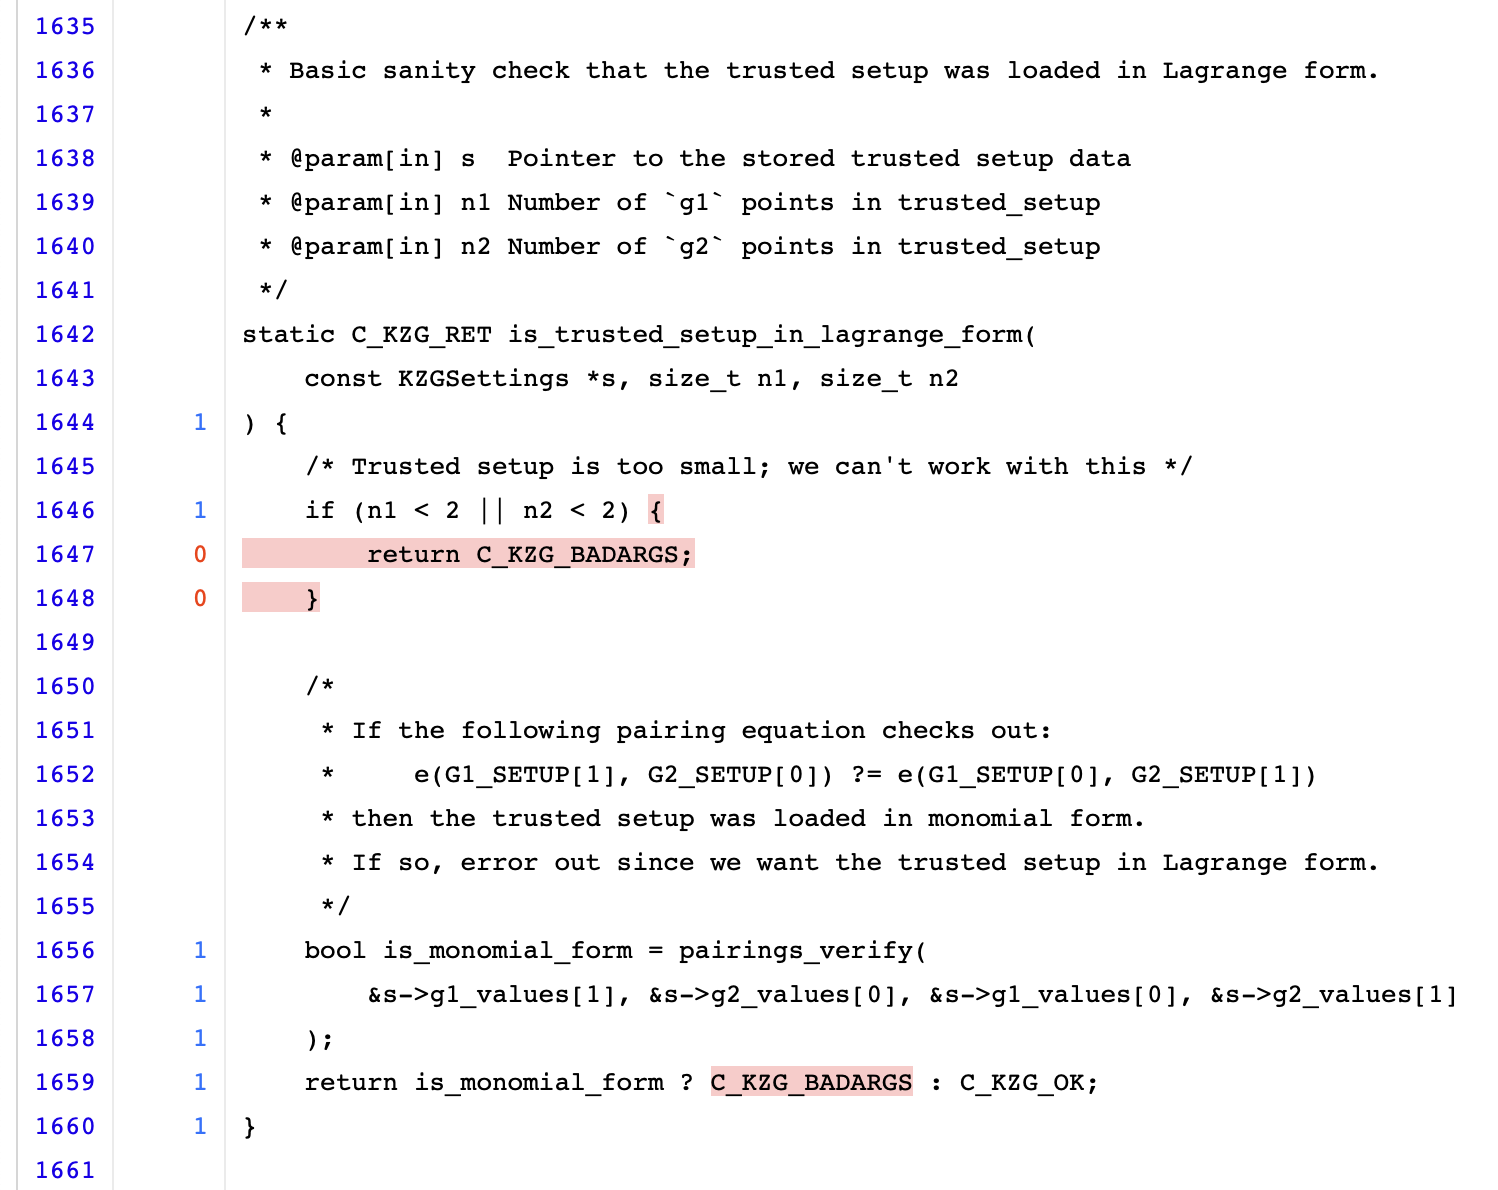
At the beginning of this function, it checks that the trusted setup is big enough to perform a pairing check. There isn’t a test case which provides an invalid trusted setup, so this doesn’t get executed. Also, because we only test with the correct trusted setup, the result of is_monomial_form is always the same and doesn’t return the error value.
Profile
We don’t recommend this for all projects, but since c-kzg-4844 is a performance critical library we think it’s important to profile its exported functions and measure how long they take to execute. This can help identify inefficiencies which could potentially DoS nodes. For this, we used gperftools (Google Performance Tools) instead of llvm-xray because we found it to be more feature-rich and easier to use.
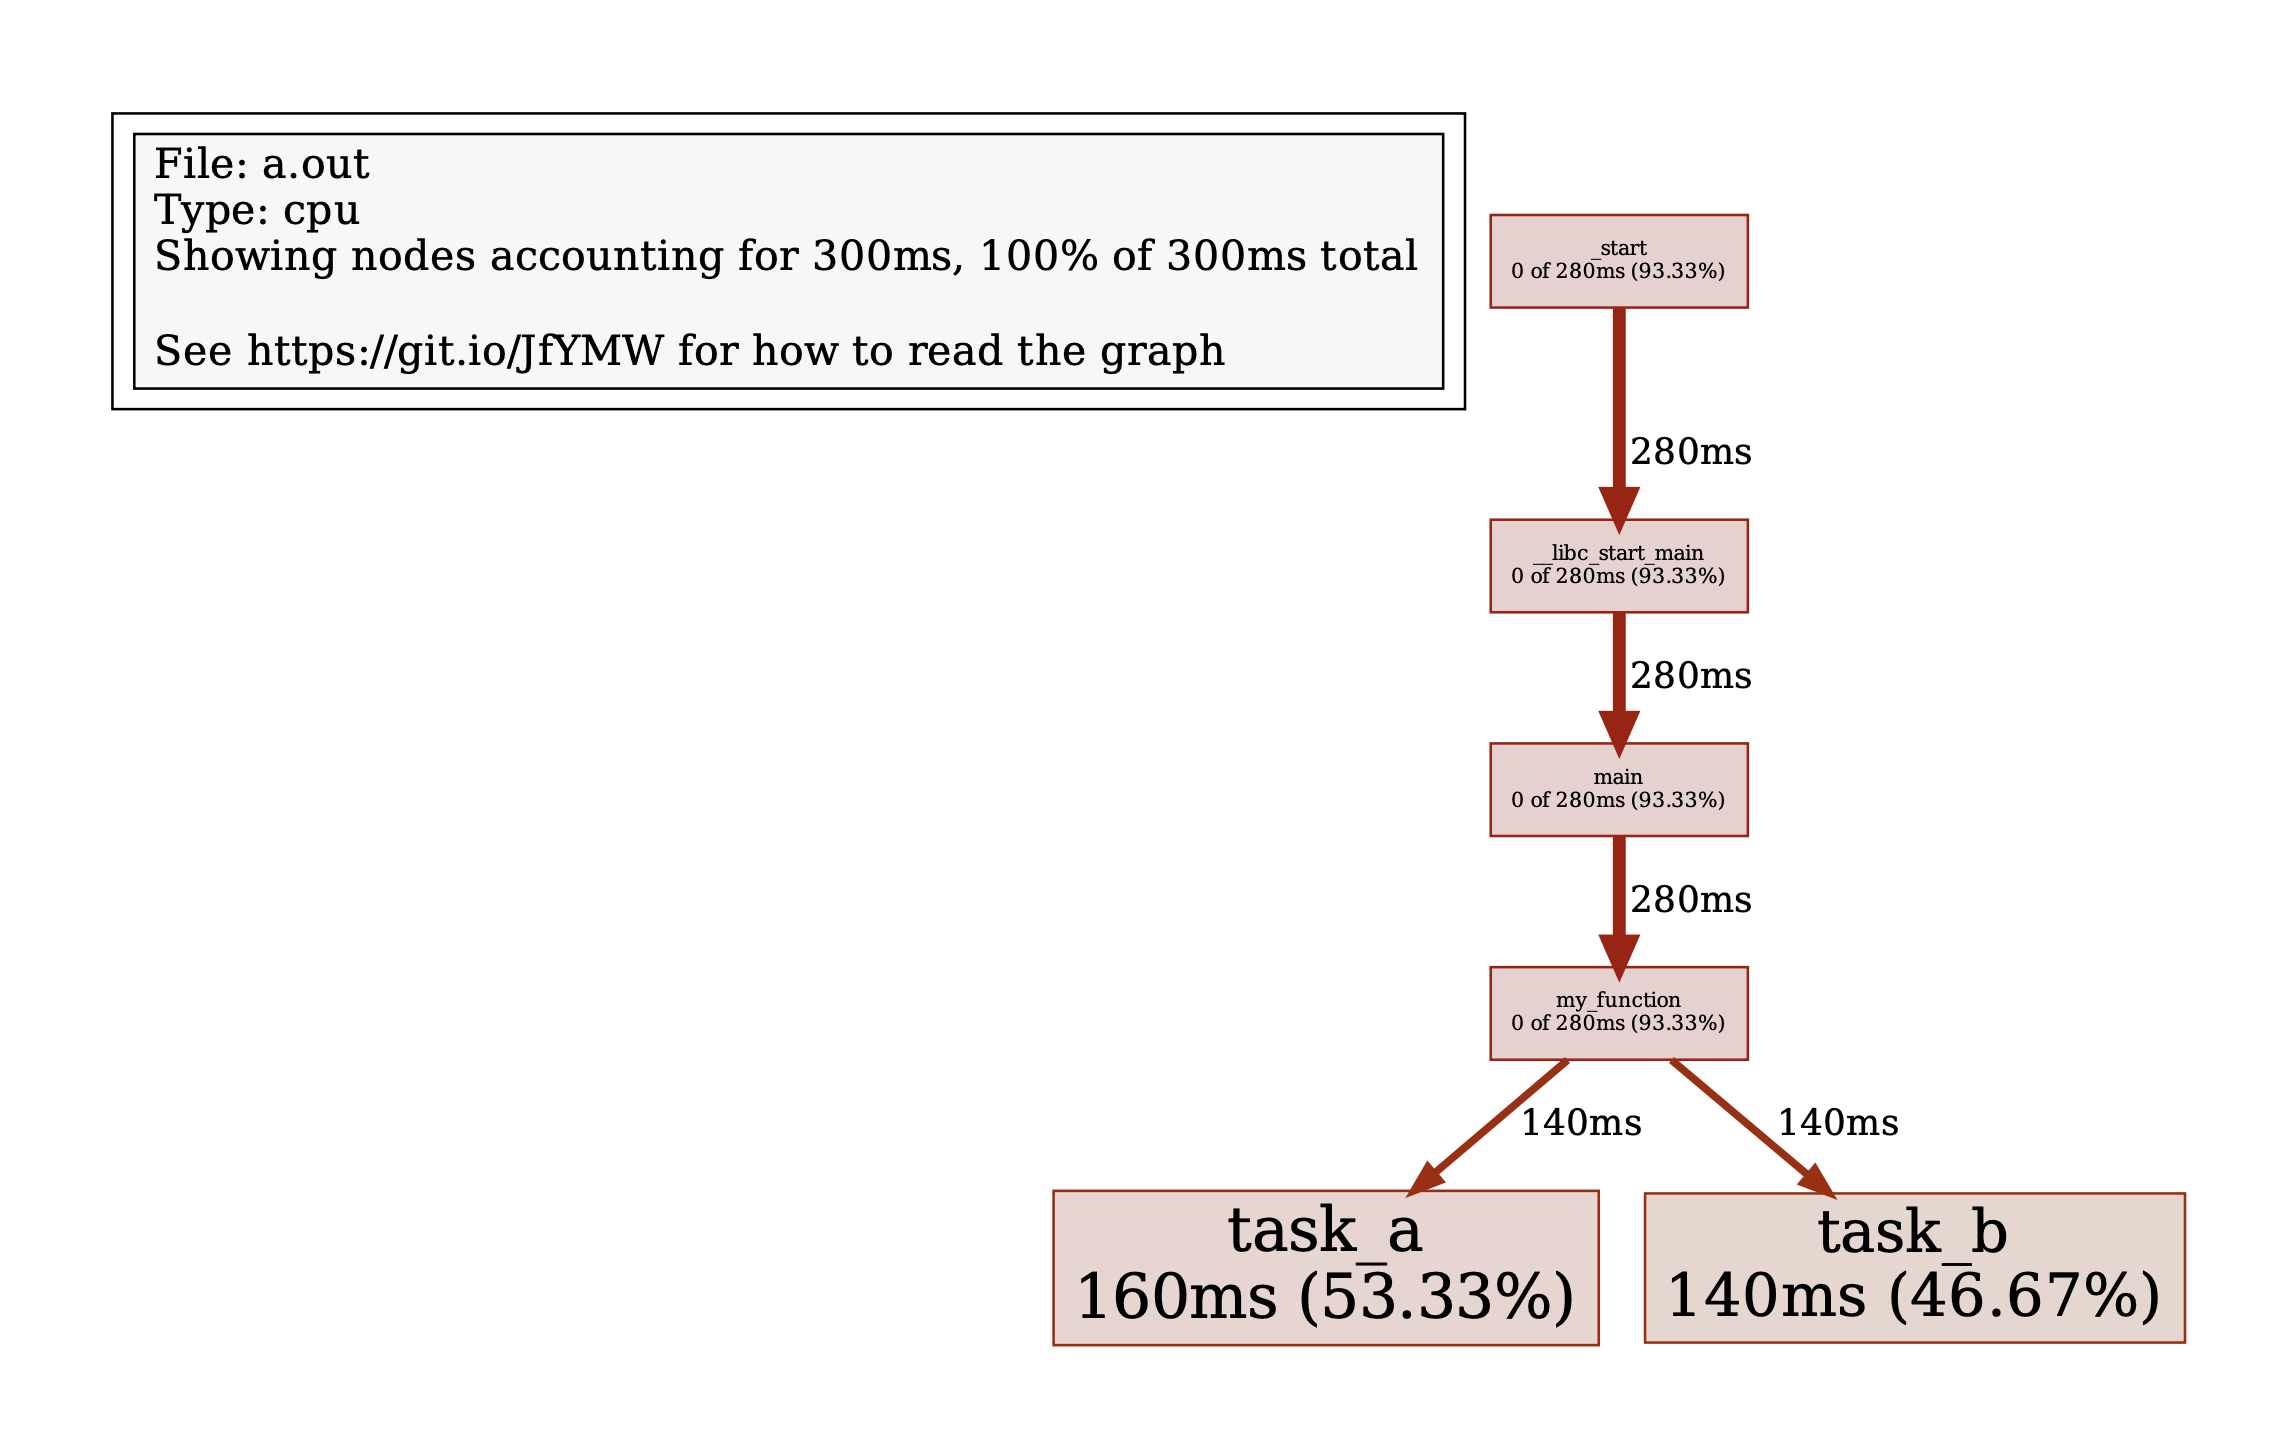
The following is a simple example which profiles my_function. Profiling works by checking which instruction is being executed every so often. If a function is fast enough, it may not be noticed by the profiler. To reduce the chance of this, you may need to call your function multiple times. In this example, we call my_function 1000 times.
#includeint task_a(int n) { if (n return task_a(n - 1) * n; } int task_b(int n) { if (n return task_b(n - 2) + n; } void my_function(void) { for (int i = 0; i if (i % 2 == 0) { task_a(i); } else { task_b(i); } } } int main(void) { ProfilerStart("example.prof"); for (int i = 0; i my_function(); } ProfilerStop(); return 0; }
Use ProfilerStart(“

Here is the graph generated from the command above:
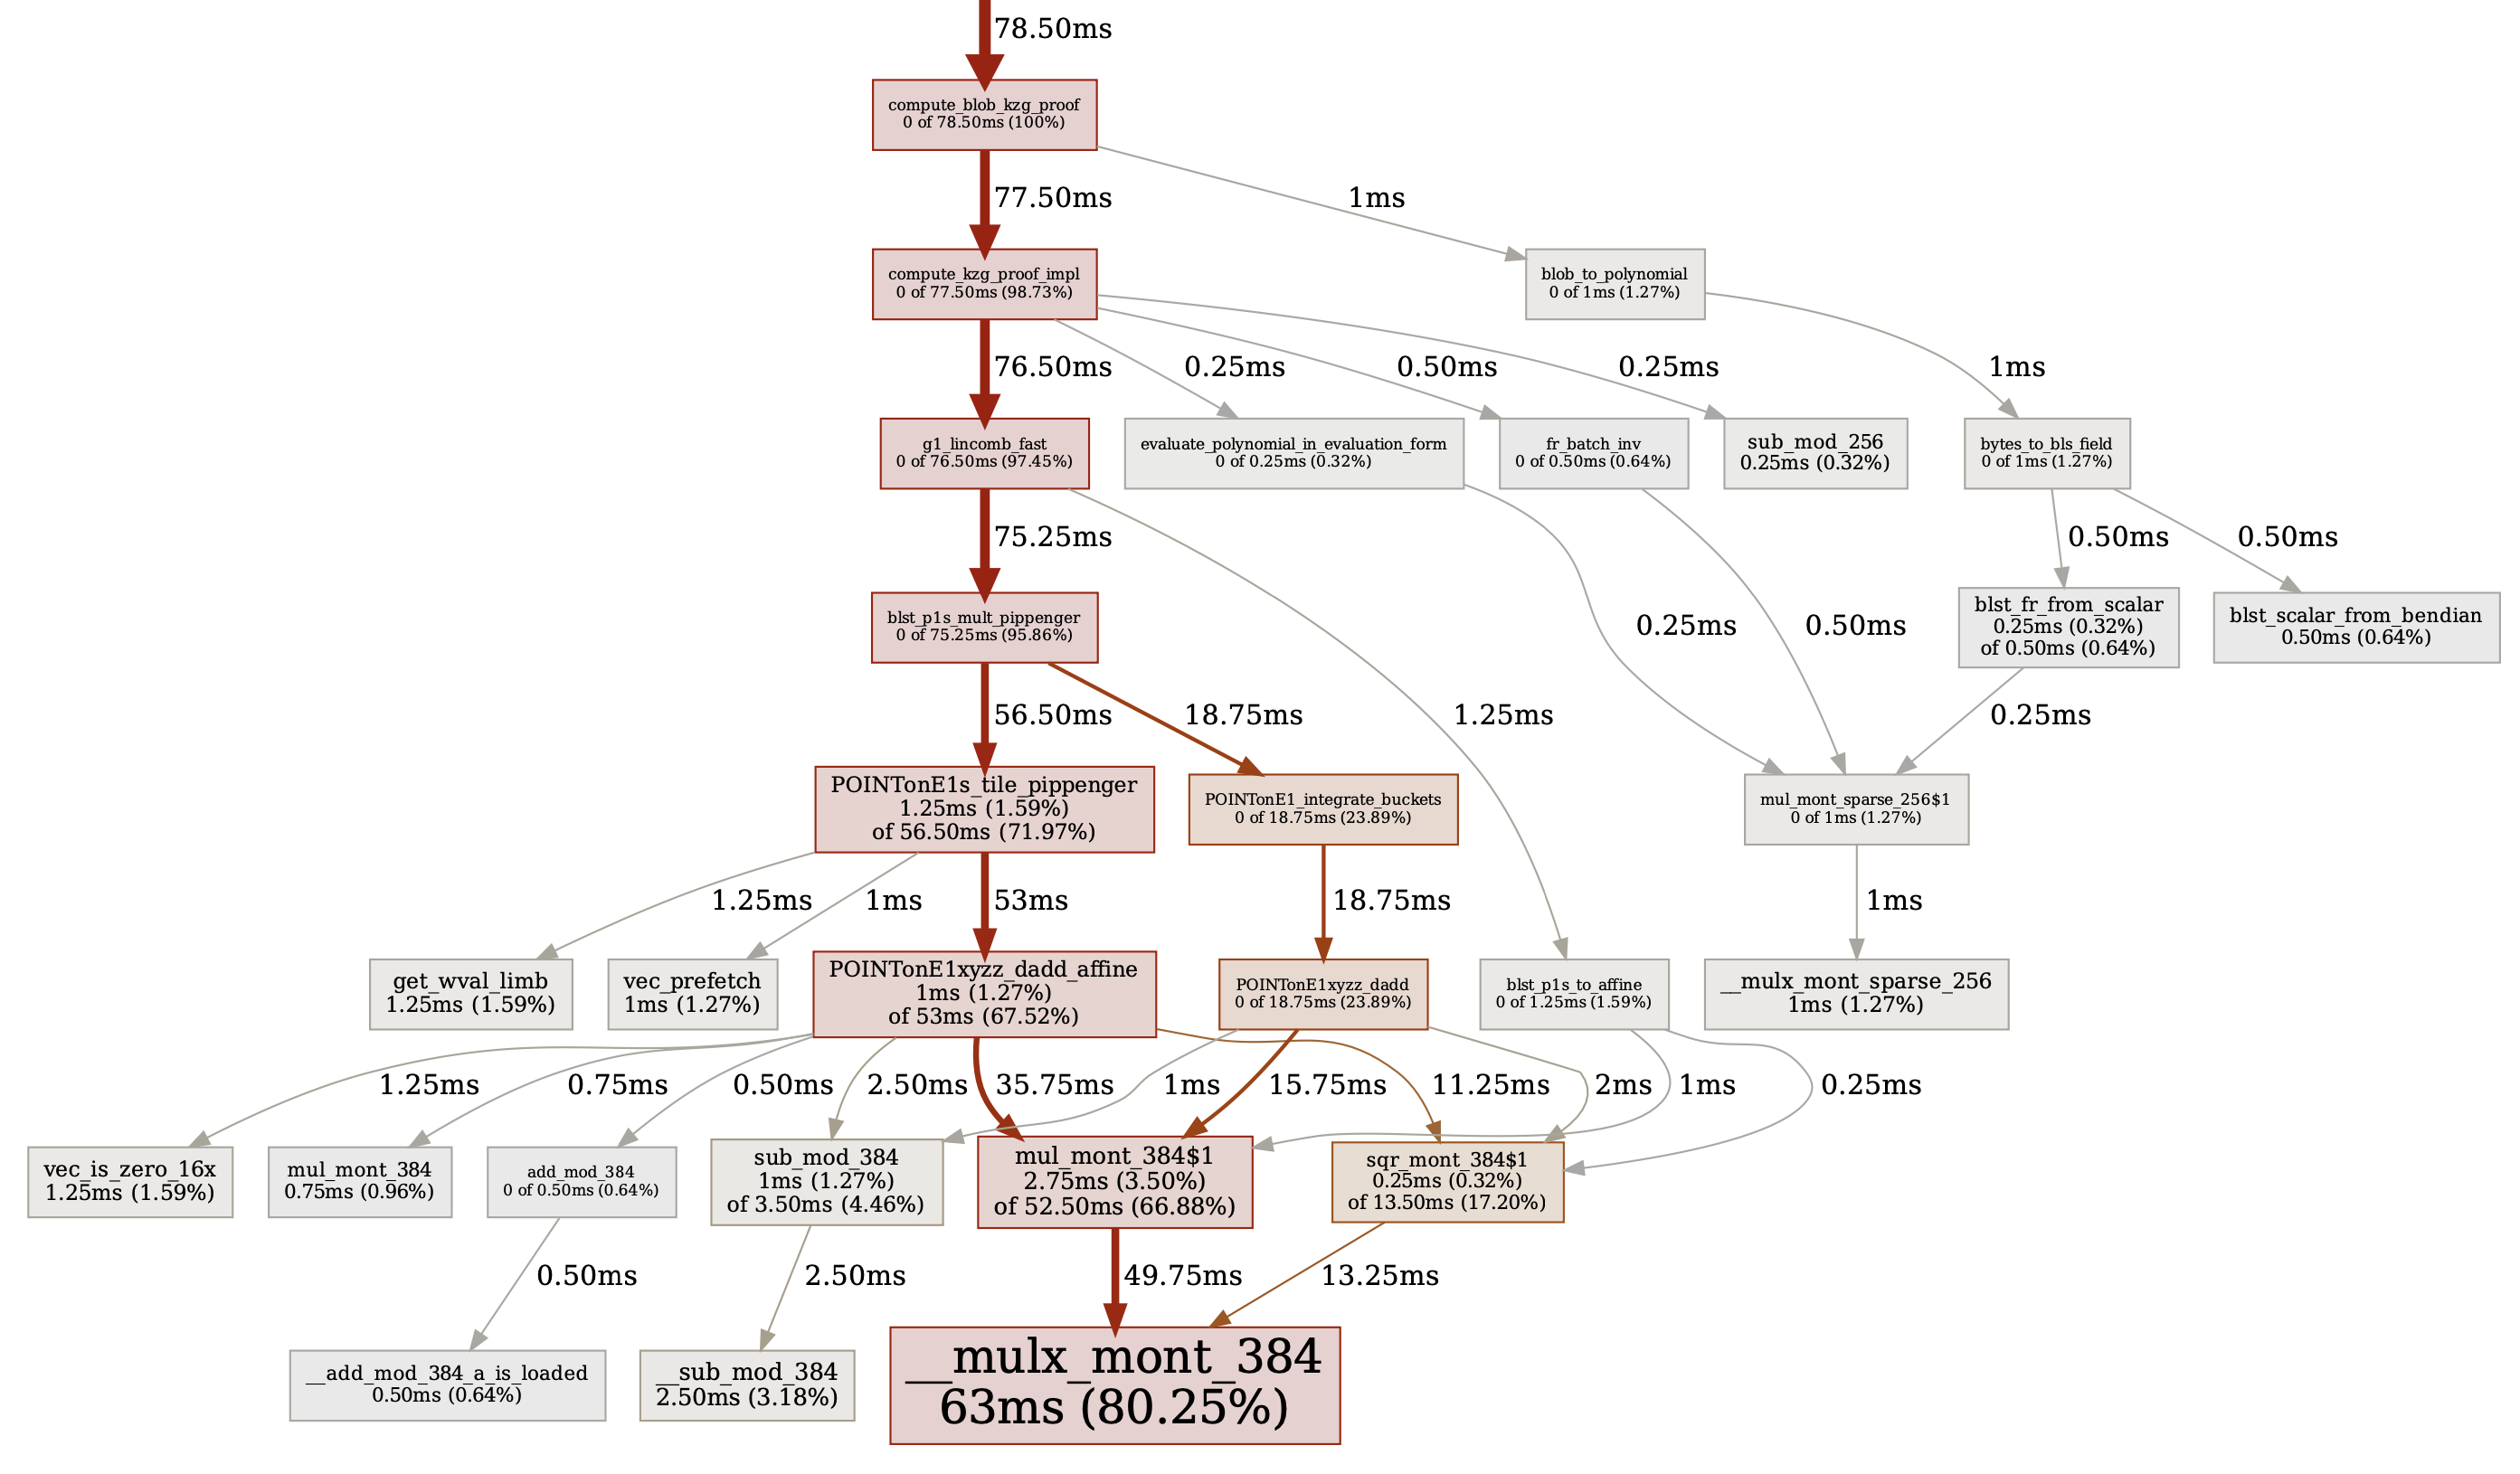
Here’s a bigger example from one of c-kzg-4844’s functions. The following image is the profiling graph for compute_blob_kzg_proof. As you can see, 80% of this function’s time is spent performing Montgomery multiplications. This is expected.
Reverse
Next, view your binary in a software reverse engineering (SRE) tool such as Ghidra or IDA. These tools can help you understand how high-level constructs are translated into low-level machine code. We think it helps to review your code this way; like how reading a paper in a different font will force your brain to interpret sentences differently. It’s also useful to see what type of optimizations your compiler makes. It’s rare, but sometimes the compiler will optimize out something which it deemed unnecessary. Keep an eye out for this, something like this actually happened in c-kzg-4844, some of the tests were being optimized out.
When you view a decompiled function, it will not have variable names, complex types, or comments. When compiled, this information isn’t included in the binary. It will be up to you to reverse engineer this. You’ll often see functions are inlined into a single function, multiple variables declared in code are optimized into a single buffer, and the order of checks are different. These are just compiler optimizations and are generally fine. It may help to build your binary with DWARF debugging information; most SREs can analyze this section to provide better results.
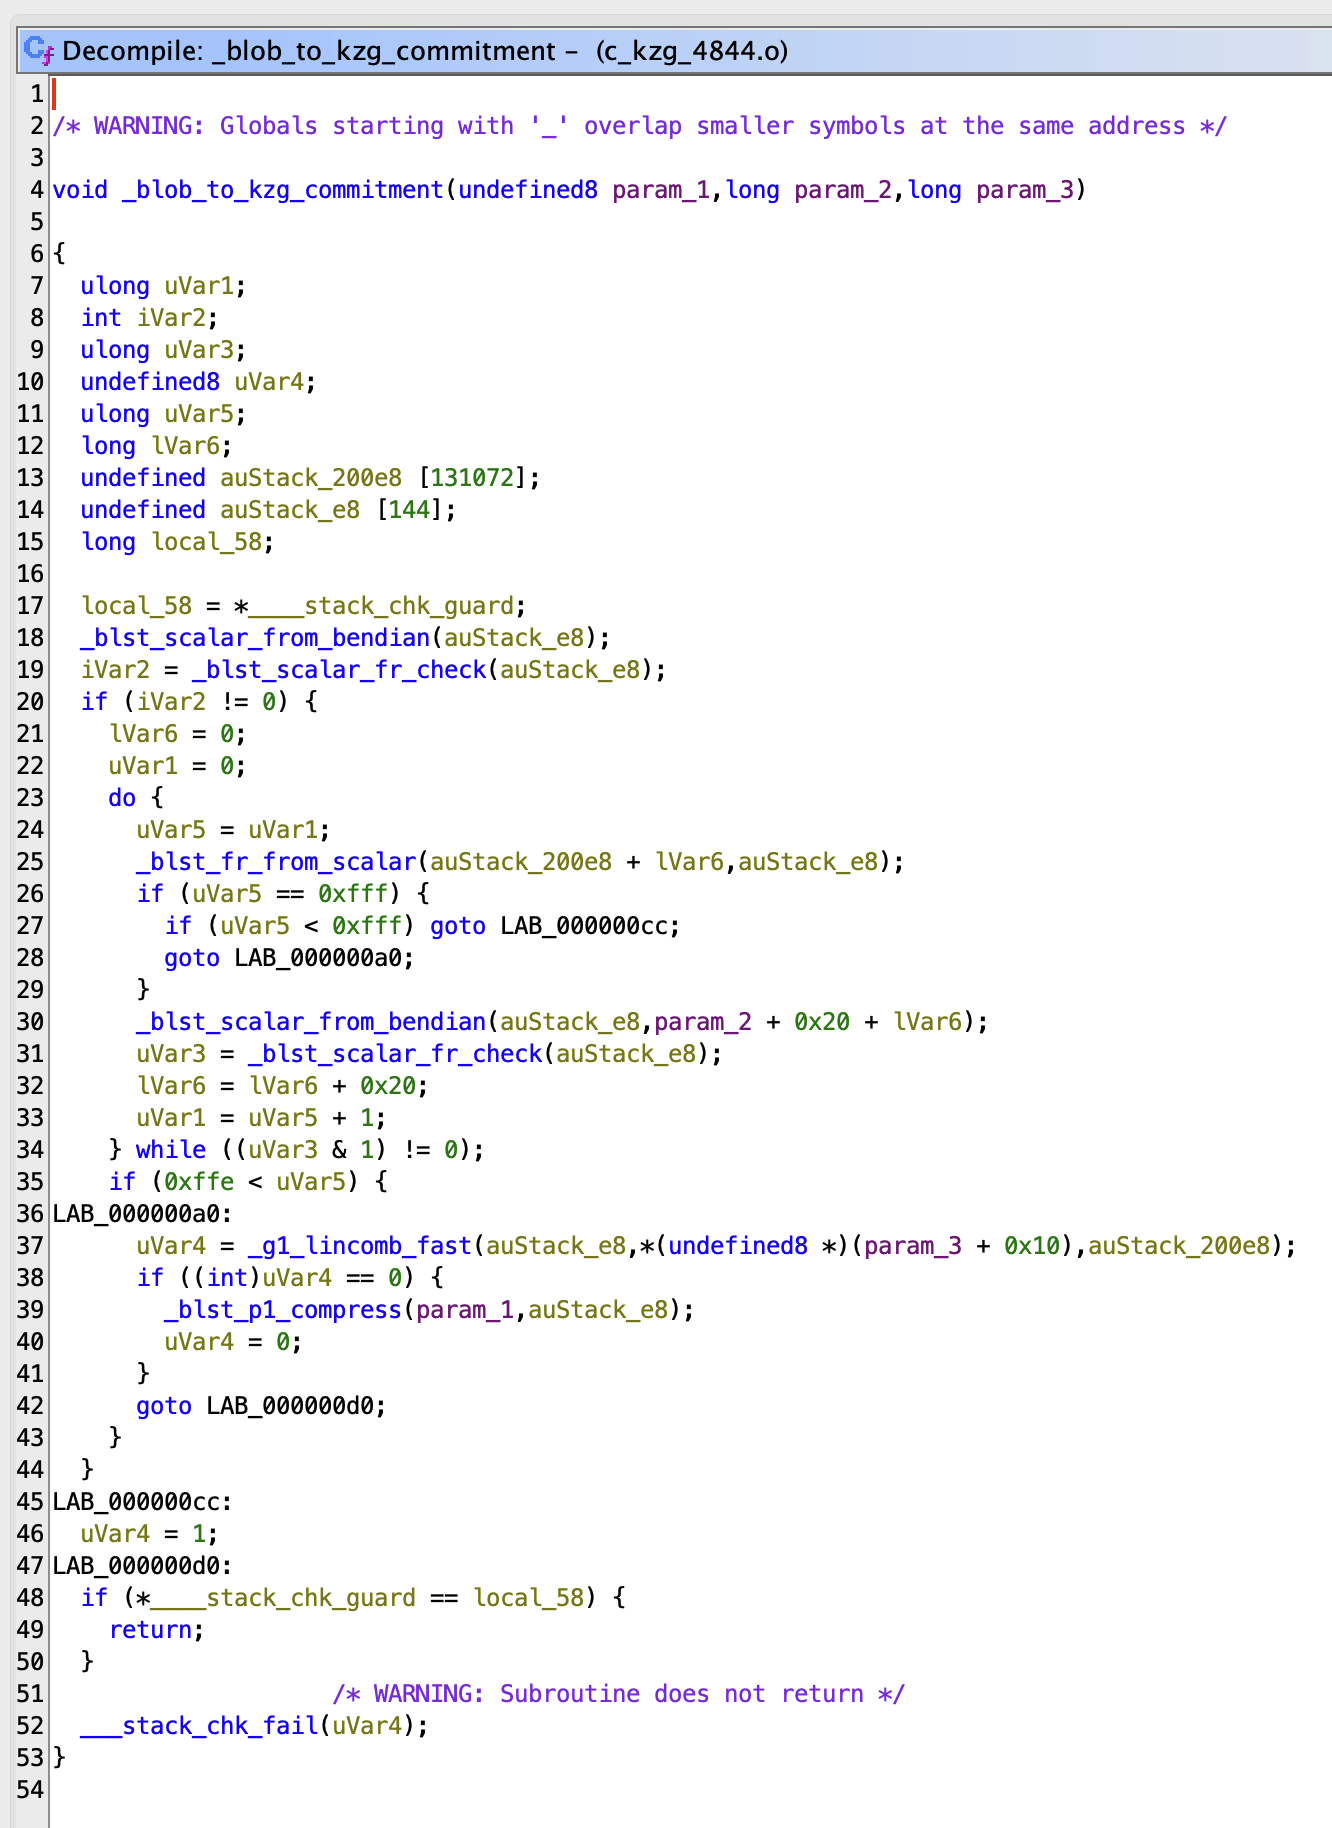
For example, this is what blob_to_kzg_commitment initially looks like in Ghidra:
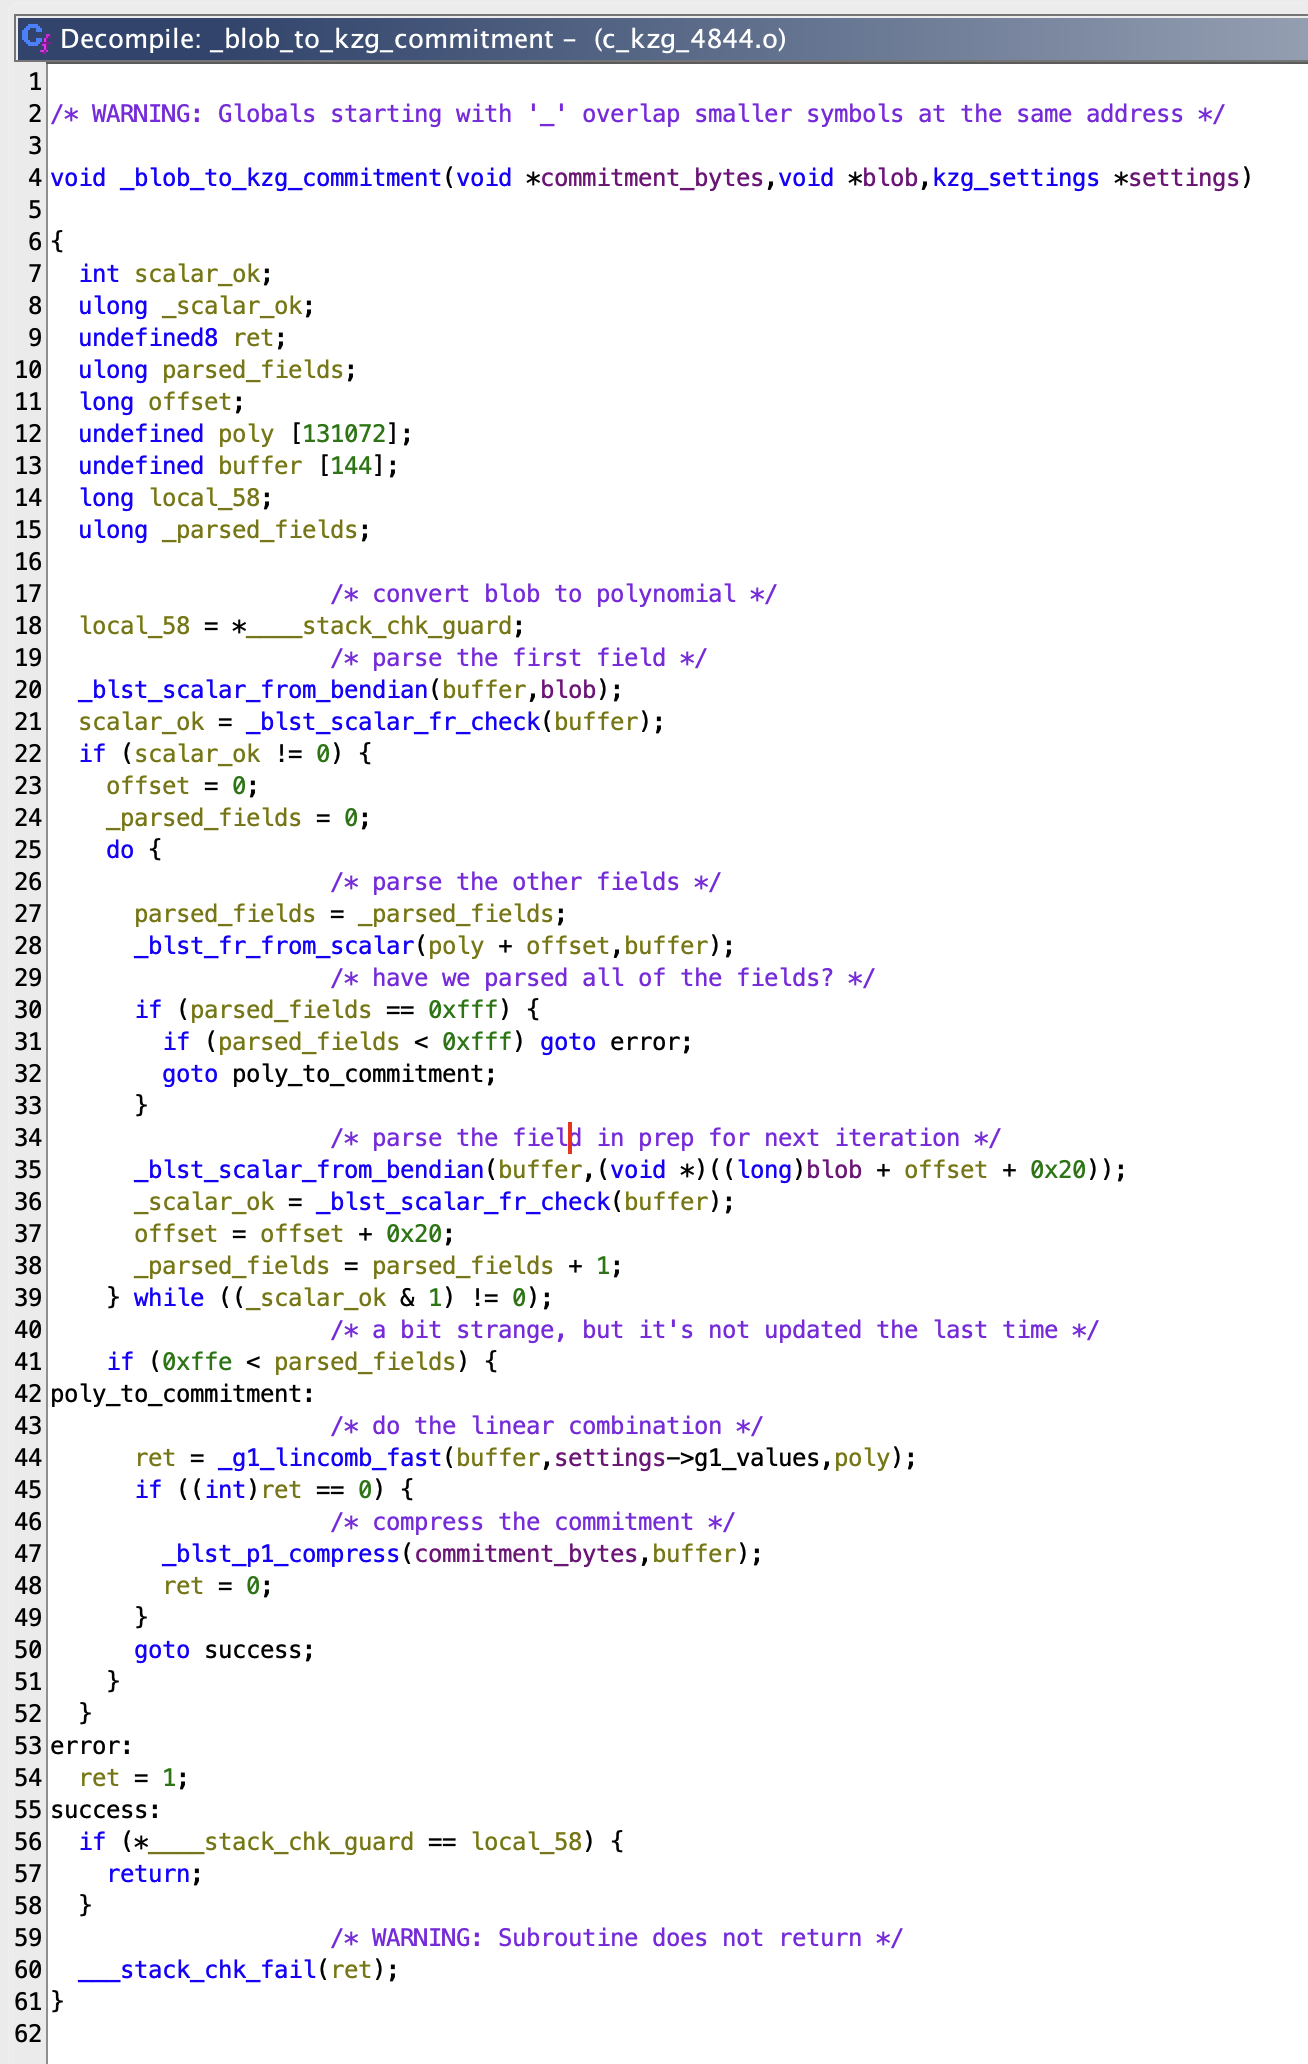
With a little work, you can rename variables and add comments to make it easier to read. Here’s what it could look like after a few minutes:
Static Analysis
Clang comes built-in with the Clang Static Analyzer, which is an excellent static analysis tool that can identify many problems that the compiler will miss. As the name “static” suggests, it examines code without executing it. This is slower than the compiler, but a lot faster than “dynamic” analysis tools which execute code.
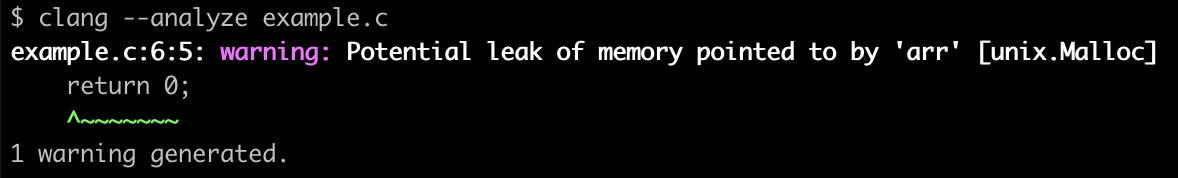
Here’s a simple example which forgets to free arr (and has another problem but we will talk more about that later). The compiler will not identify this, even with all warnings enabled because technically this is completely valid code.
#includeint main(void) { int* arr = malloc(5 * sizeof(int)); arr[5] = 42; return 0; }
The unix.Malloc checker will identify that arr wasn’t freed. The line in the warning message is a bit misleading, but it makes sense if you think about it; the analyzer reached the return statement and noticed that the memory hadn’t been freed.
Not all of the findings are that simple though. Here’s a finding that Clang Static Analyzer found in c-kzg-4844 when initially introduced to the project:

Given an unexpected input, it was possible to shift this value by 32 bits which is undefined behavior. The solution was to restrict the input with CHECK(log2_pow2(n) != 0) so that this was impossible. Good job, Clang Static Analyzer!
Sanitize
Santizers are dynamic analysis tools which instrument (add instructions) to programs which can point out issues during execution. These are particularly useful at finding common mistakes associated with memory handling. Clang comes built-in with several sanitizers; here are the four we find most useful and easy to use.
Address
AddressSanitizer (ASan) is a fast memory error detector which can identify out-of-bounds accesses, use-after-free, use-after-return, use-after-scope, double-free, and memory leaks.
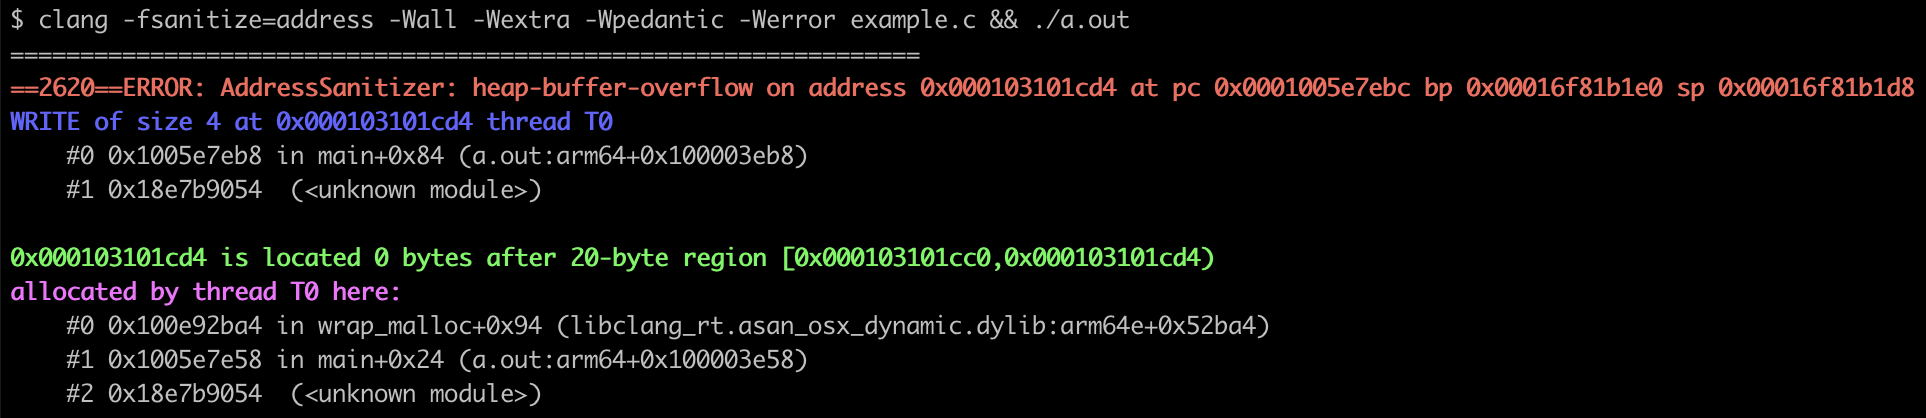
Here is the same example from earlier. It forgets to free arr and it will set the 6th element in a 5 element array. This is a simple example of a heap-buffer-overflow:
#includeint main(void) { int* arr = malloc(5 * sizeof(int)); arr[5] = 42; return 0; }
When compiled with -fsanitize=address and executed, it will output the following error message. This points you in a good direction (a 4-byte write in main). This binary could be viewed in a disassembler to figure out exactly which instruction (at main+0x84) is causing the problem.
Similarly, here’s an example where it finds a heap-use-after-free:
#includeint main(void) { int *arr = malloc(5 * sizeof(int)); free(arr); return arr[2]; }
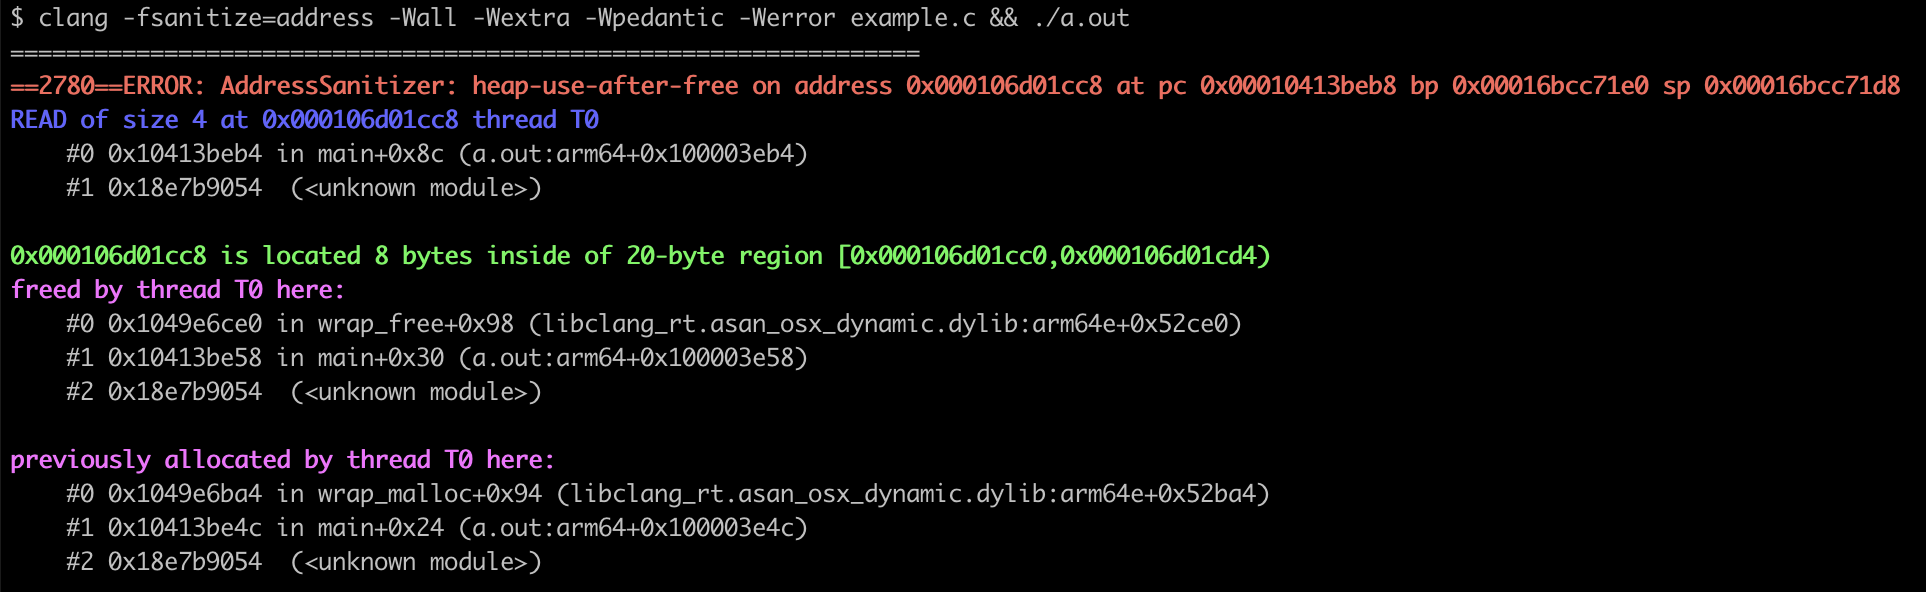
It tells you that there’s a 4-byte read of freed memory at main+0x8c.
Memory
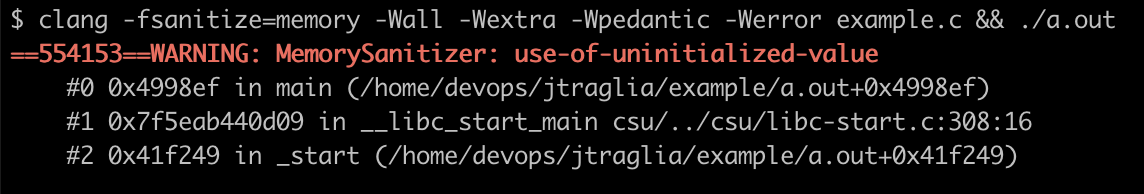
MemorySanitizer (MSan) is a detector of uninitialized reads. Here’s a simple example which reads (and returns) an uninitialized value:
int main(void) {
    int data[2];
    return data[0];
}
When compiled with -fsanitize=memory and executed, it will output the following error message:
Undefined Behavior
UndefinedBehaviorSanitizer (UBSan) detects undefined behavior, which refers to the situation where a program’s behavior is unpredictable and not specified by the langauge standard. Some common examples of this are accessing out-of-bounds memory, dereferencing an invalid pointer, reading uninitialized variables, and overflow of a signed integer. For example, here we increment INT_MAX which is undefined behavior.
#includeint main(void) { int a = INT_MAX; return a + 1; }
When compiled with -fsanitize=undefined and executed, it will output the following error message which tells us exactly where the problem is and what the conditions are:

Thread
ThreadSanitizer (TSan) detects data races, which can occur in multi-threaded programs when two or more threads access a shared memory location at the same time. This situation introduces unpredictability and can lead to undefined behavior. Here’s an example in which two threads increment a global counter variable. There aren’t any locks or semaphores, so it’s entirely possible that these two threads will increment the variable at the same time.
#includeint counter = 0; void *increment(void *arg) { (void)arg; for (int i = 0; i counter++; return NULL; } int main(void) { pthread_t thread1, thread2; pthread_create(&thread1, NULL, increment, NULL); pthread_create(&thread2, NULL, increment, NULL); pthread_join(thread1, NULL); pthread_join(thread2, NULL); return 0; }
When compiled with -fsanitize=thread and executed, it will output the following error message:
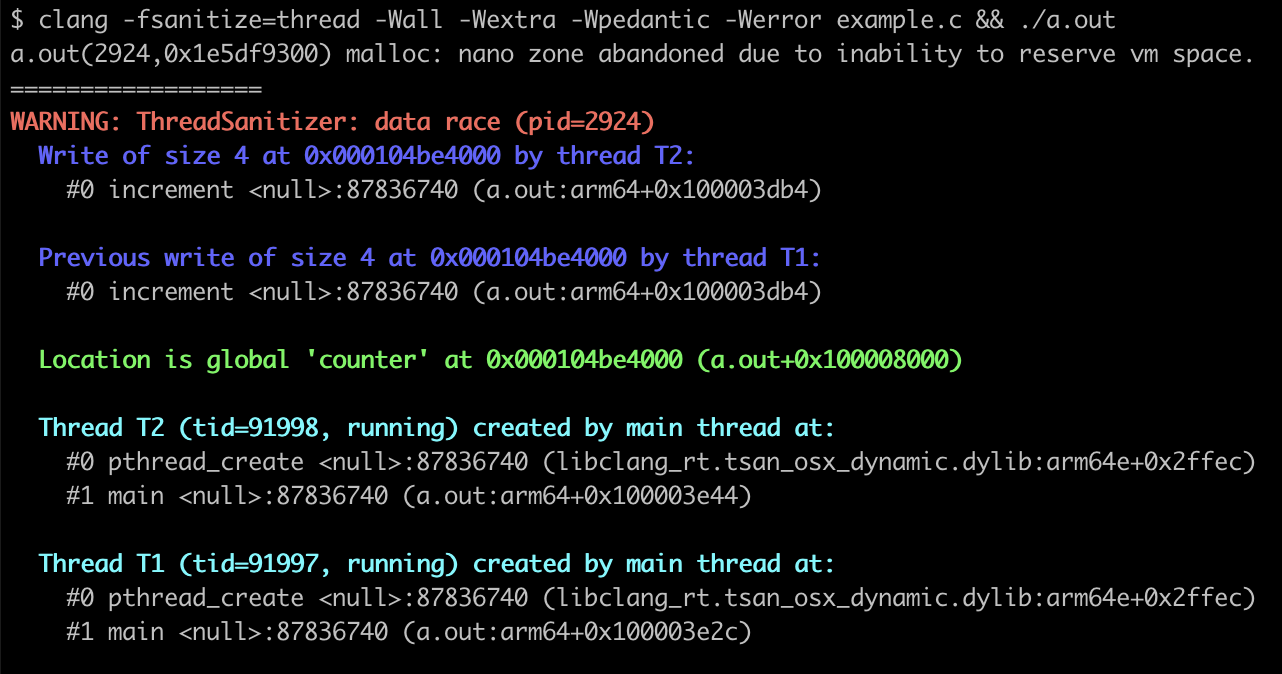
This error message tells us that there’s a data race. In two threads, the increment function is writing to the same 4 bytes at the same time. It even tells us that the memory is counter.
Valgrind
Valgrind is a powerful instrumentation framework for building dynamic analysis tools, but its best known for identifying memory errors and leaks with its built-in Memcheck tool.
The following image shows the output from running c-kzg-4844’s tests with Valgrind. In the red box is a valid finding for a “conditional jump or move [that] depends on uninitialized value(s).”
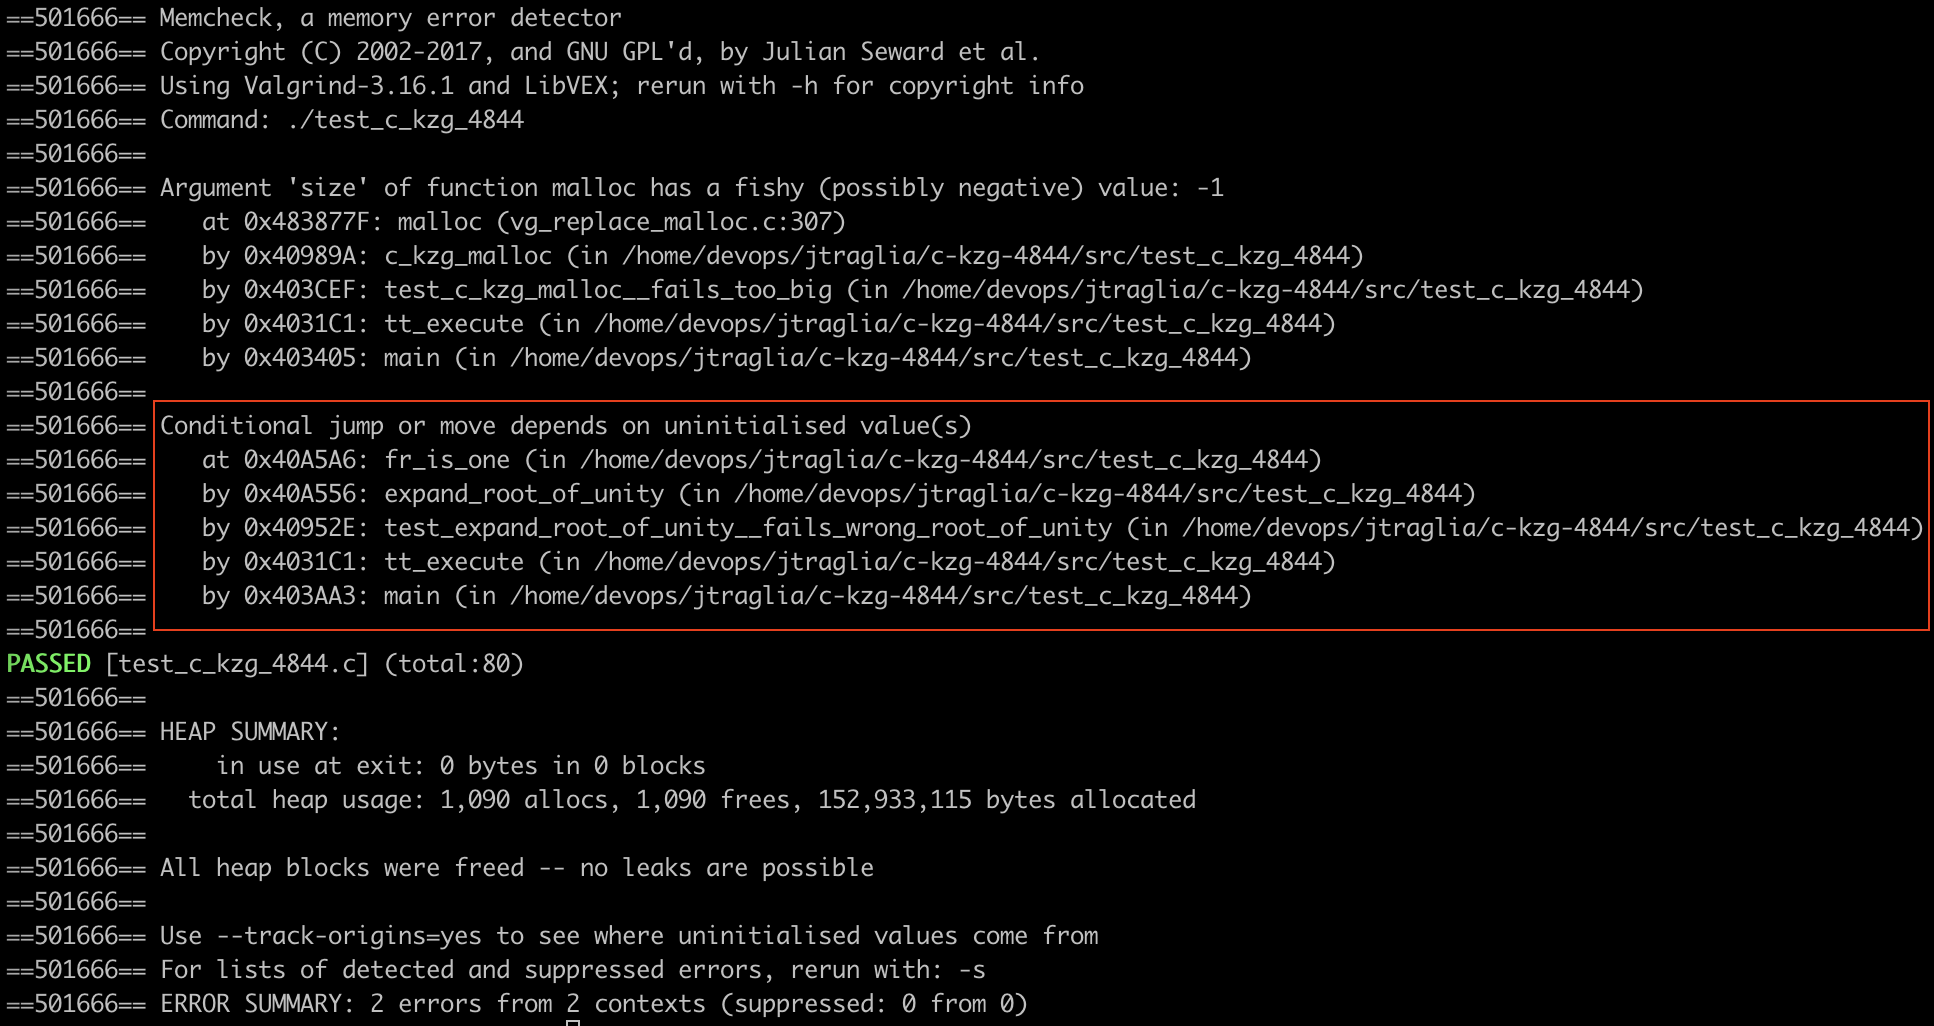
This identified an edge case in expand_root_of_unity. If the wrong root of unity or width were provided, it was possible that the loop will break before out[width] was initialized. In this situation, the final check would depend on an uninitialized value.
static C_KZG_RET expand_root_of_unity(
    fr_t *out, const fr_t *root, uint64_t width
) {
    out[0] = FR_ONE;
    out[1] = *root;

    for (uint64_t i = 2; !fr_is_one(&out[i - 1]); i++) {
        CHECK(i         blst_fr_mul(&out[i], &out[i - 1], root);
    }
    CHECK(fr_is_one(&out[width]));

    return C_KZG_OK;
}
Security Review
After development stabilizes, it’s been thoroughly tested, and your team has manually reviewed the codebase themselves multiple times, it’s time to get a security review by a reputable security group. This won’t be a stamp of approval, but it shows that your project is at least somewhat secure. Keep in mind there is no such thing as perfect security. There will always be the risk of vulnerabilities.
For c-kzg-4844 and go-kzg-4844, the Ethereum Foundation contracted Sigma Prime to conduct a security review. They produced this report with 8 findings. It contains one critical vulnerability in go-kzg-4844 that was a really good find. The BLS12-381 library that go-kzg-4844 uses, gnark-crypto, had a bug which allowed invalid G1 and G2 points to be sucessfully decoded. Had this not been fixed, this could have resulted in a consensus bug (a disagreement between implementations) in Ethereum.
Bug Bounty
If a vulnerability in your project could be exploited for gains, like it is for Ethereum, consider setting up a bug bounty program. This allows security researchers, or anyone really, to submit vulnerability reports in exchange for money. Generally, this is specifically for findings which can prove that an exploit is possible. If the bug bounty payouts are reasonable, bug finders will notify you of the bug rather than exploiting it or selling it to another party. We recommend starting your bug bounty program after the findings from the first security review are resolved; ideally, the security review would cost less than the bug bounty payouts.
Conclusion
The development of robust C projects, especially in the critical domain of blockchain and cryptocurrencies, requires a multi-faceted approach. Given the inherent vulnerabilities associated with the C language, a combination of best practices and tools is essential for producing resilient software. We hope our experiences and findings from our work with c-kzg-4844 provide valuable insights and best practices for others embarking on similar projects.


首席执行官说,比特币,以太坊交易即将推出-350x250.jpg)


首席执行官说,比特币,以太坊交易即将推出-120x86.jpg)